Petrochemicals Inorganic materials Rubber and plastic resins Economics and statistics Paper and cardboard Steel and metals Agriculture and fertilizers Food and Beverages Recyclates Energy and Fuels Price trend data & tools to create benchmarks and leading indicators
Petrochem Inorganic Rubber Resins Economics Paper Metals Agriculture Food Recyclate Energy Fuel
Price trend data & tools to create benchmarks and leading indicators
GET ACCESS NOW
Our subscription fee is US$399/year for access to ALL data and online tools. We offer a 30-day trial for US$30 with full access, and you can be online in 2 minutes.
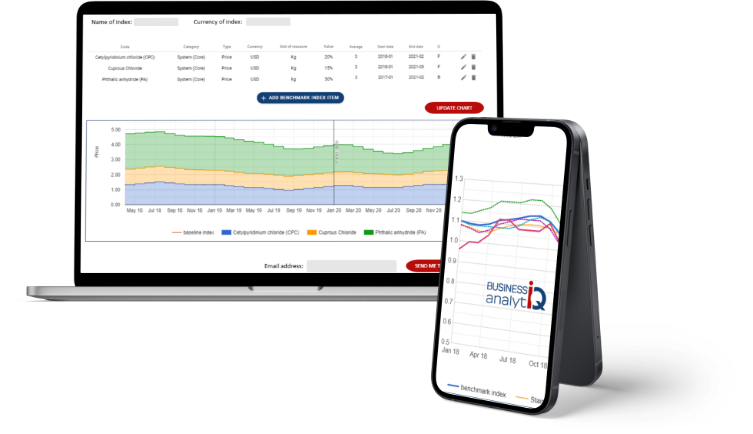
Business Analytiq System Features
Improve Price &
Market Visibility
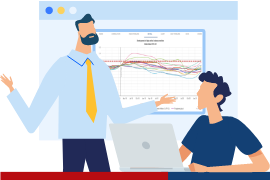
Establish Benchmarks
& Leading Indicators

Keep Up to Date on
Industry Developments

Improve Price &
Market Visibility

Establish Benchmarks
& Leading Indicators

Keep Up to Date on
Industry Developments
Business Benefits
Reduce
Material Cost

Improve Stakeholder
Communication

Improve
Negotiations
Improve
Planning

Reduce Risk
of Surprises

Save Cost
and Time

Reduce
Material Cost

Improve Stakeholder
Communication

Improve
Negotiations

Improve
Planning

Reduce Risk
of Surprises

Save Cost
and Time
Customers
Trend Tracks
Downloads
2-minute summary of use-cases
Companies We Help Today






























Pricing
USER LICENSE
30-day trial for US$30
US$399/year
1 user license (license can be shared)
Access to ALL price & market trends
Unlimited data downloads
Switch to preferred FX and UOM
Access to all benchmarking tools
Our price guarantee:
- 30-day trial for US$30. Full access to data & tools
- 2 opt-out emails sent before annual subscription charge
- We will NEVER increase price of a continued subscription
Frequently Asked Questions
How often do we update the data?
- We aim to update the data series on the 12th of each month (or earlier)
- We will often do an update around the 25th of the month
Where does the data come from?
- The source of the data are exclusively public non-confidential sources.
- We have no access to primary data from suppliers or customers
- This the index trend of the price trend of the "product category" in general, and not a single specification of the product in particular
- The data is a combination of contract and spot pricing
- Our automated algorithms are set up to eliminate significant product mix impact on the trend
- The reported price is likely to be at the lower end of market pricing
- We combine public publications, import/export records, trading prices, company announcements, magazine articles, tweets, and other sources of ad-hoc public information.
- The chart shows the our best approximation of the market trend based on our automated algorithm´s interpretation of the signals
- For most indexes we have multiple sources and the automation focuses on using statistically-correlated sources
- As a function of our automation, it is likely that recent trends will be adjusted as we discover more information. So, for example, the price trend for February 2024 will be first calculated in February 2024 and is likely to be adjusted in March, April and May 2024.
- The algorithm will regularly revise our understanding of market trends, and indicated market trends may change
- The data is presented in US$.
- The UOM of measure is shown in the Index list table
Where does the data NOT come from?
- We do not purchase data from any other source and republish it.
- We will not purchase data from any other source and republish it
- We do not extrapolate trends, even for the forecast.
- We look for market signals and leading indicators
What data should our company use?
- If you are making decisions driving significant share of profit, we always recommend that you buy data from the companies who invest in direct market access such as ICIS, amongst many others
- Our data, at best, represents an estimate of the market trend based on public information
- We have no direct access to the market, and we do not interview suppliers and customers
- Our automated analysis tools in the online software are set up to combine our data with other sources of data
What does the quality indication in the main menu mean?
We indicate the quality level of each data trend individually inside our tool. On our website, we assign the quality level per category.
- Quality level A: Data is from a reliable and confirmed source
- Quality level B: Data is from multiple credible sources and there are no major statistical inconsistencies between them
- Quality level C: Data is from multiple credible sources and there are some minor statistical inconsistencies between the trends
- Quality level D: Data is from a single credible source, but we cannot verify the data
- Quality level E: Data is either:
- From a single source, which we consider reliable, but we cannot verify the data.
- From 2 or more sources which have some periods of contradicting trends.
- Quality level F: Data is from a single source which we consider indicatively correct, but the data is anecdotal and we cannot verify the data.
Changes to historical trends
- As a function of our process & automation, recent trends are likely to be fientuned as we receive more information. So, for example, the price trend for February 2024 will be first calculated in February 2024 and adjusted in March, April and May 2024.
- The algorithm could also revise historical trends, as we find and process additional sources of information. Previously indicated market trends may change
- We will only change history if
- We believe it improves the accuracy of the trend
- We can use the new source of information on an ongoing basis
- From January 2025, new rules will be implemented:
- From January 2025, series of Quality A and B will not have the history (older than 4 months) changed
- Series of Quality C will only have minor changes to the trend in future, when we are able to re-classify it as Quality B
- Series of Quality D could see possible see revisions in future as we reclassify it as Quality A-C
- Series of Quality E and F are likely to see revisions in future as we reclassify them to Quality A-D
What are the disclaimers?
- We assume no responsibility or liability for any errors or omissions in the content of this site.
- The information is provided on an “as is” basis with no guarantee of completeness, accuracy, usefulness, fitness for purpose or timeliness.
- By their nature, outlooks are always uncertain
What are we doing to improve the data?
- We are continually improving our data collection and processing methods
- Pricing data will be updated from time to time as we improve the accuracy
How can i give feedback on the data or request for new indexes
- Feel free to contact us if you have a specific request. You can reach us via the Contact us page
